Smart Portfolio Visualizer
Transform your investment data into clear insights with our advanced platform. Create detailed charts, see asset allocation breakdowns, and understand your holdings distribution through powerful graphics designed for data-driven investors. Our analytics tools turn complex data into actionable information.
Portfolio Visualization Tools Made Simple
See your investments in a new light with our interactive analysis platform. Transform complex financial data into clear representations that make decision-making intuitive. Dynamic charts and graphs present your performance, helping you spot trends and patterns instantly. Perfect for investors who prefer graphics over spreadsheets, our comprehensive system makes management more accessible and insightful with interactive features that bring numbers to life.
Portfolio Performance Graphs
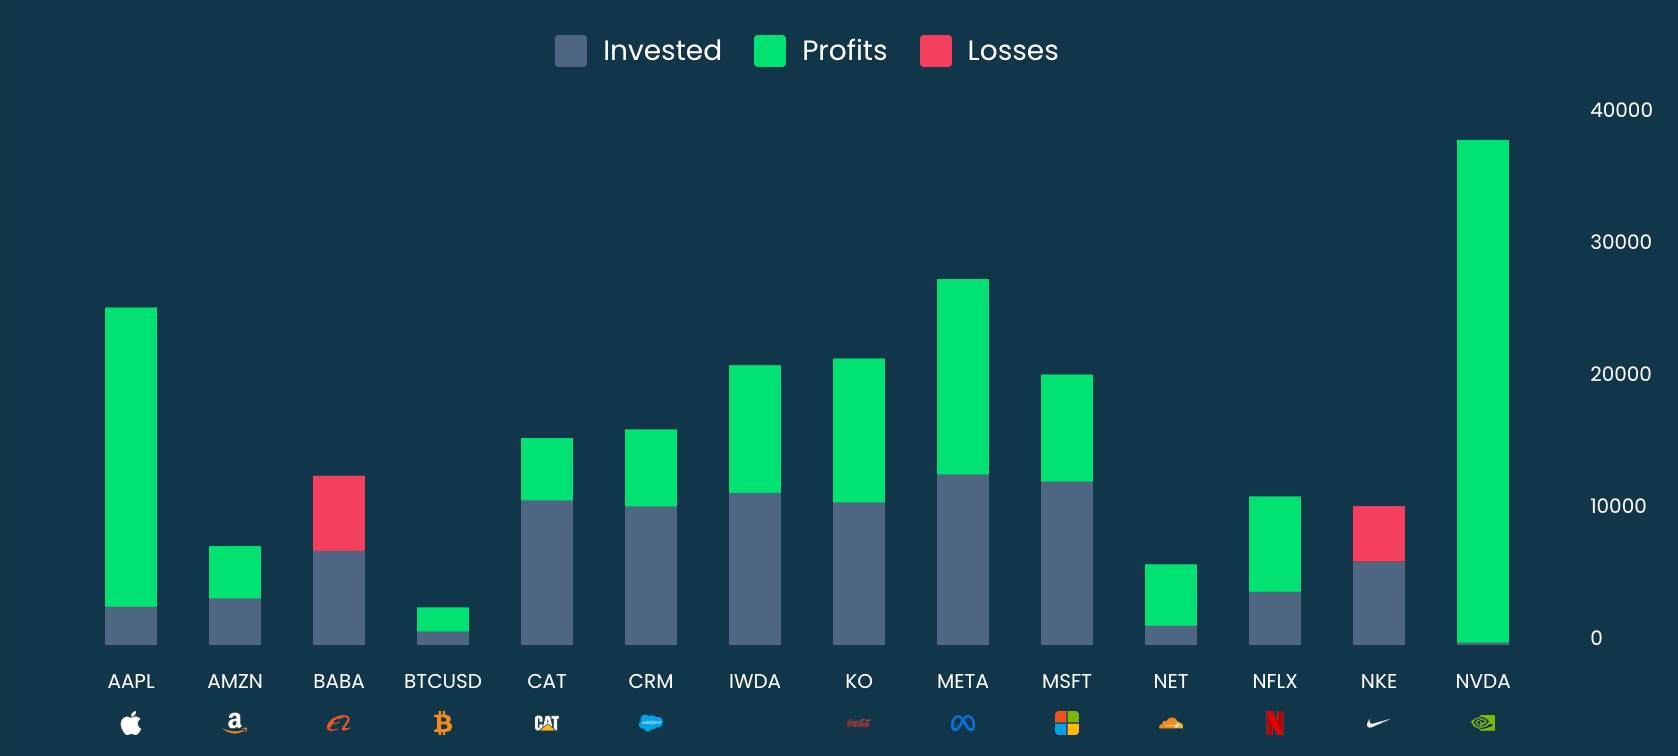
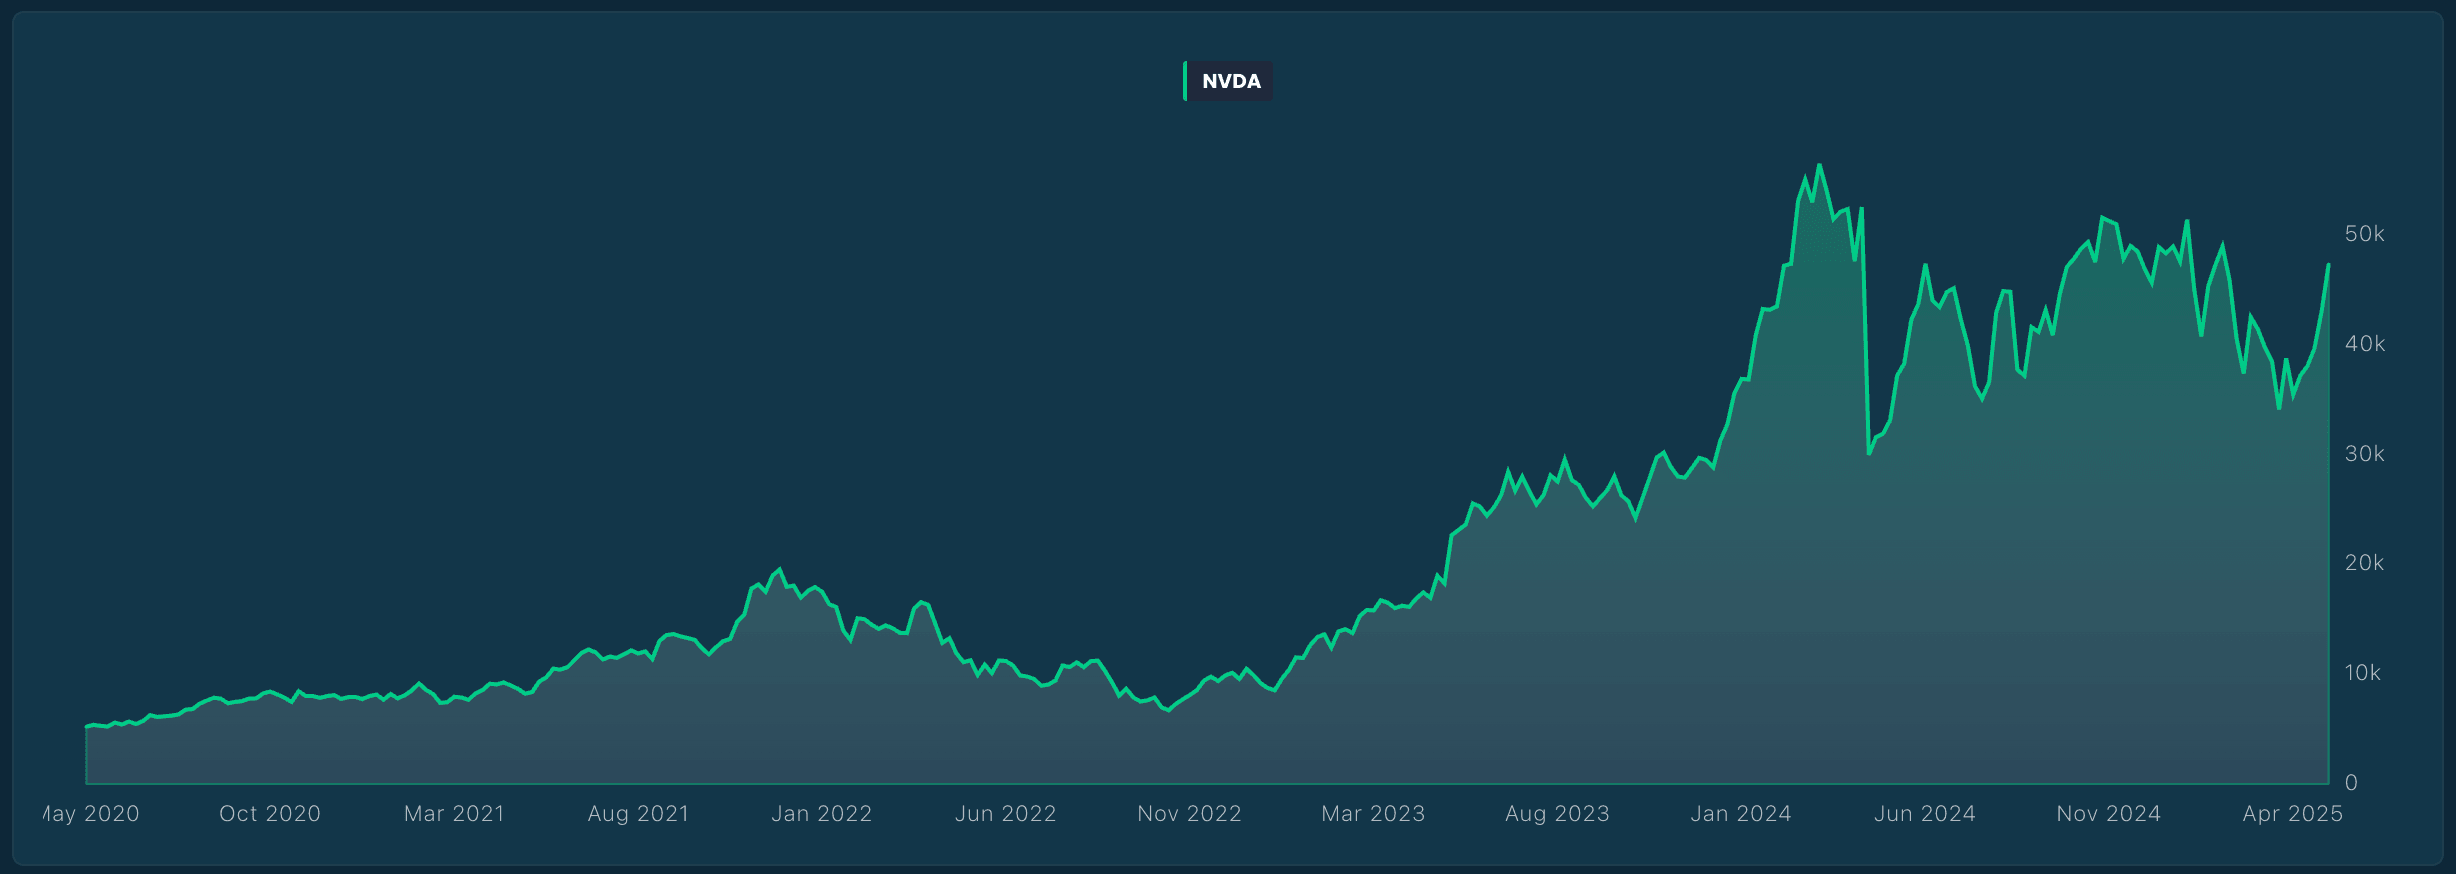
Watch your journey unfold with interactive performance charts. Track your growth trajectory across custom time periods, from days to decades. Our approach transforms abstract numbers into meaningful patterns, helping you identify success and correction points instantly. The free analysis tools present performance metrics in an engaging, accessible format that makes tracking intuitive rather than intimidating.
Asset Allocation Charts
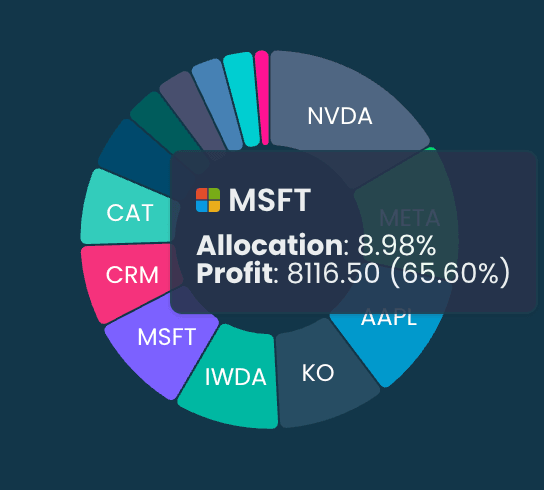
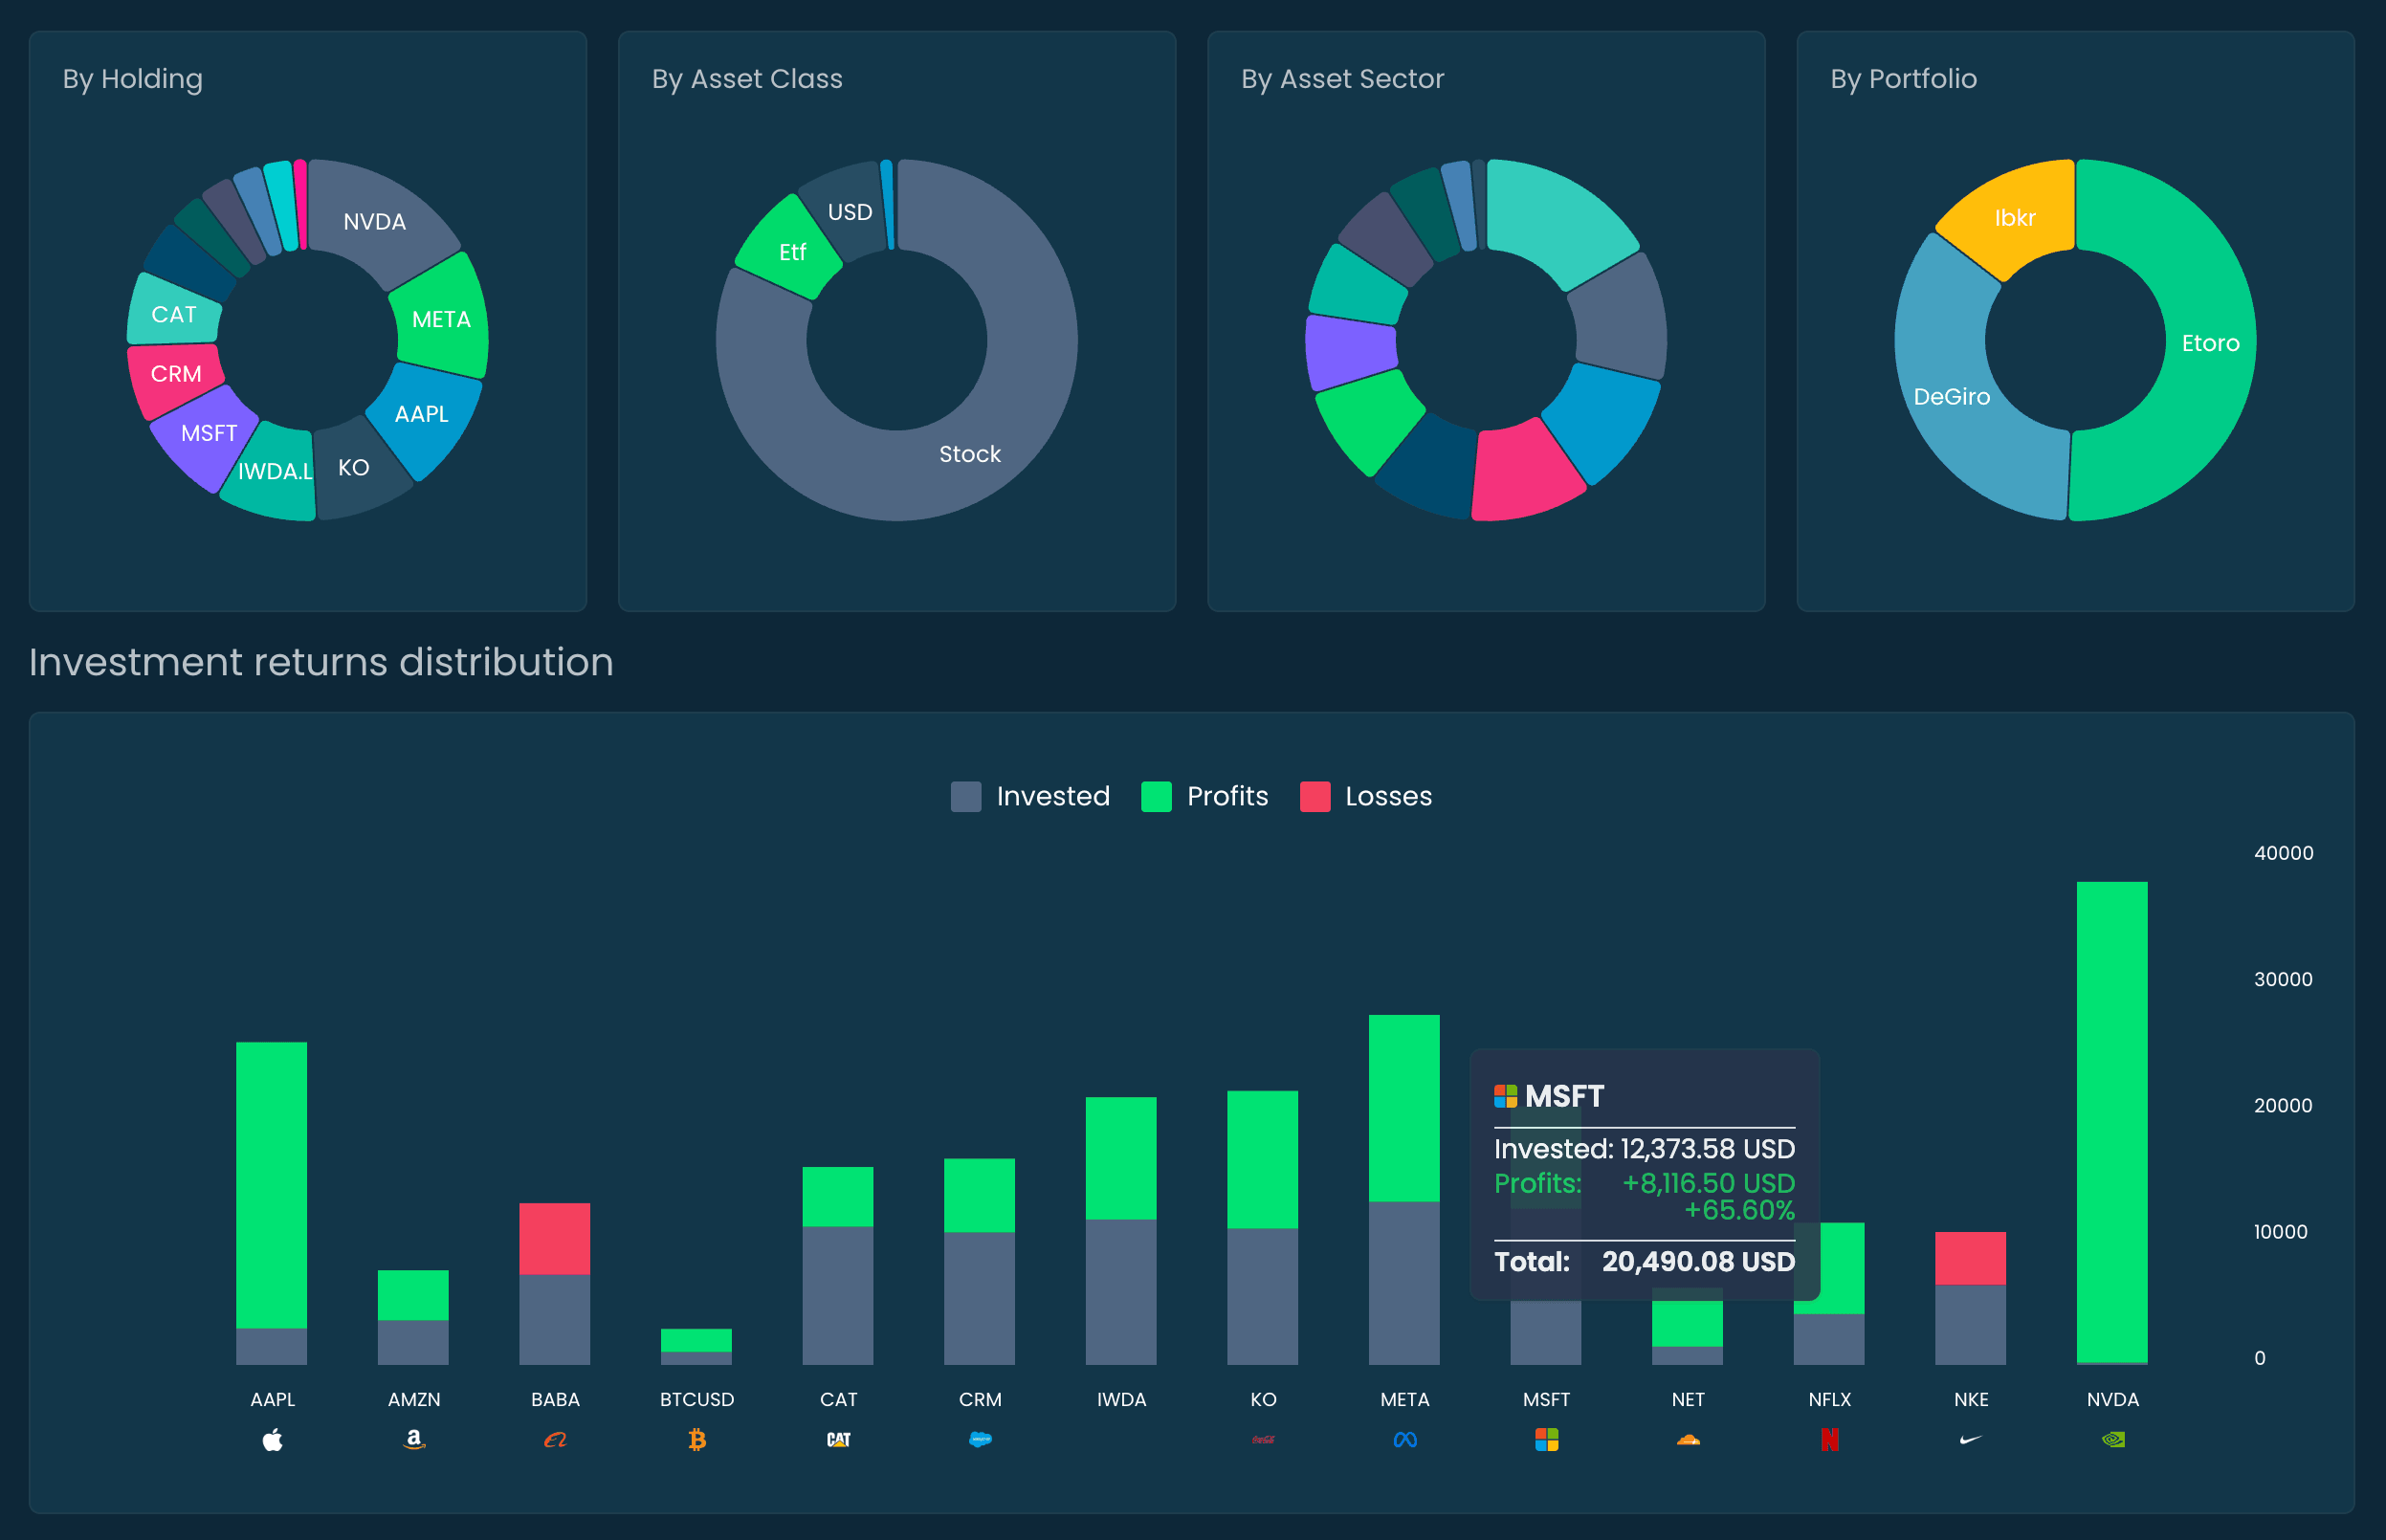
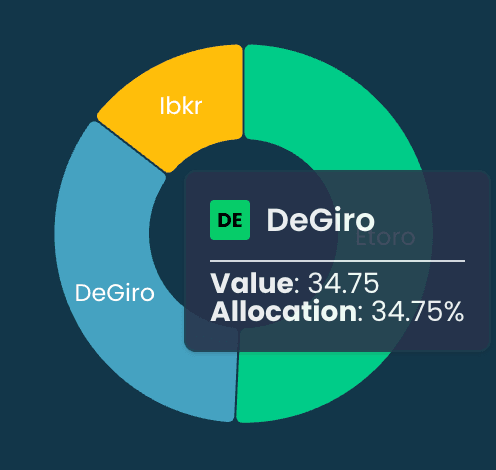
See exactly what you own with our interactive breakdown tools. Asset allocation transforms into vibrant pie charts and proportional graphics that instantly communicate distribution. These analytical tools show your diversification at a glance, revealing potential concentration risks or opportunities. The color-coded features make composition clear and accessible, helping you maintain desired allocations without drowning in spreadsheet data.
Geographic Distribution Maps
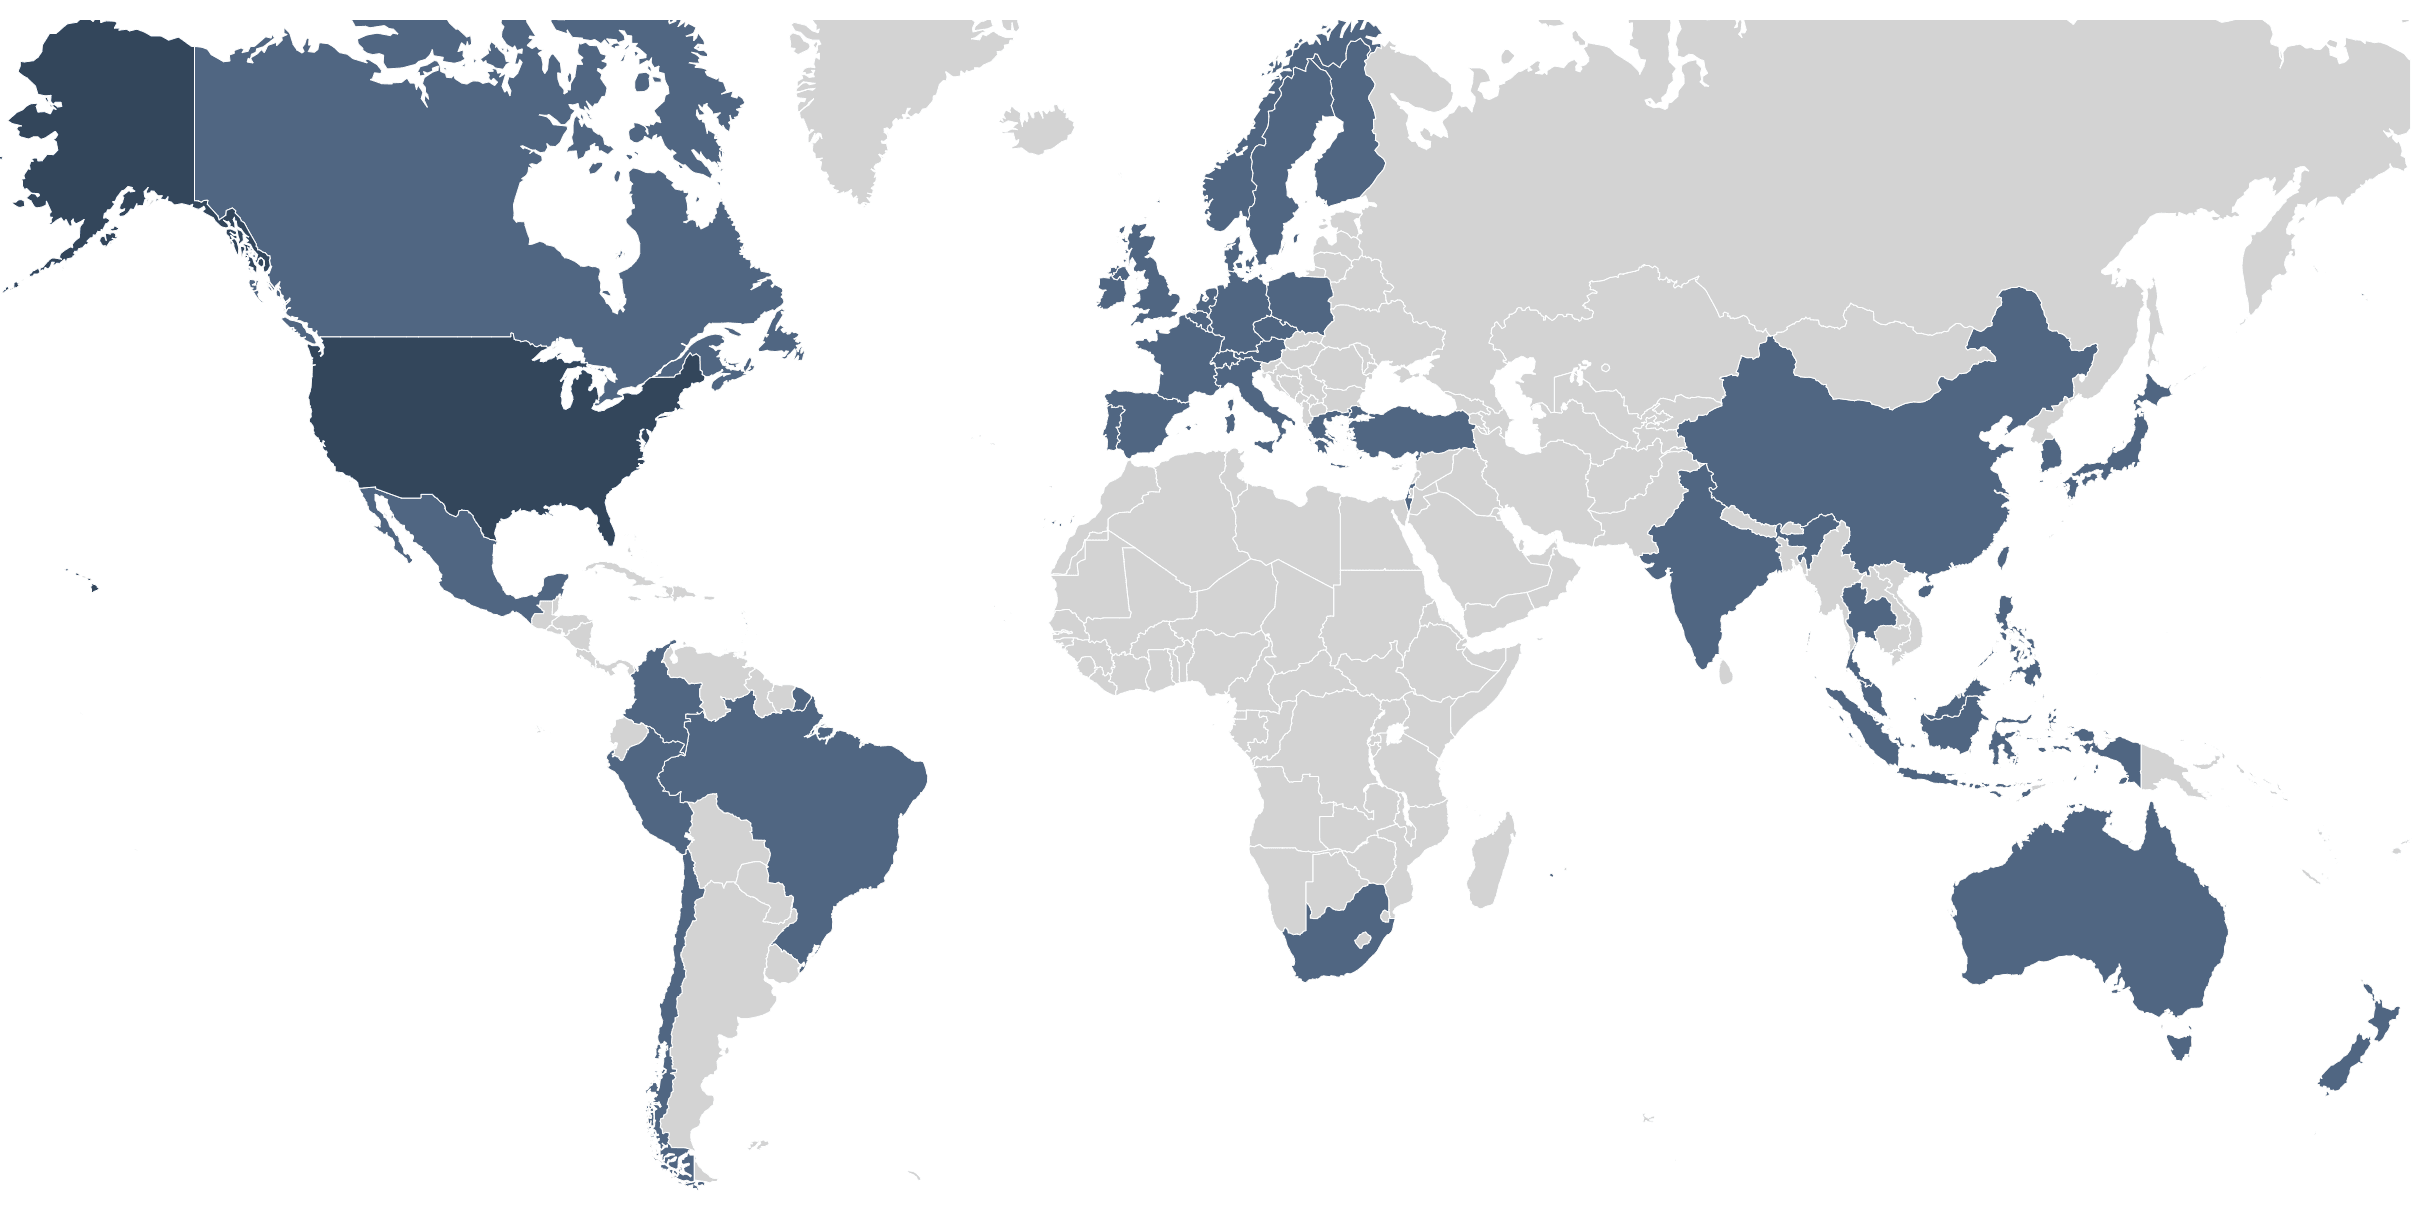
Explore your global investments through interactive map displays. Our platform translates country exposure data into engaging world maps showing concentration. These geographic maps reveal diversification at a glance, helping you balance regional exposure through analysis rather than complex tables. The interactive tool highlights opportunities in underrepresented markets and potential overexposure in others, making global investment management more intuitive.

Free Portfolio Visualizer
Experience the power of investment management with our free analytical tools. The complimentary package includes essential charts like performance tracking and basic allocation views to get you started. Upgrade to premium plans to unlock the complete toolkit with advanced features, customizable dashboards, and interactive scenarios that transform how you view and manage your assets.
Start Visualizing Your Portfolio
Begin with essential portfolio visualization tools for free. Visualize returns, track performance, and your investments. Upgrade anytime to access advanced analytics features.
